Creating Dashboards
Connect allows you to create different dashboards to display specific reports and graphs.
Creating a Dashboard
To create a new dashboard:
Navigate to the Dashboard screen.
Click the Create Dashboard (
 ) icon.
The Create Dashboard screen displays.
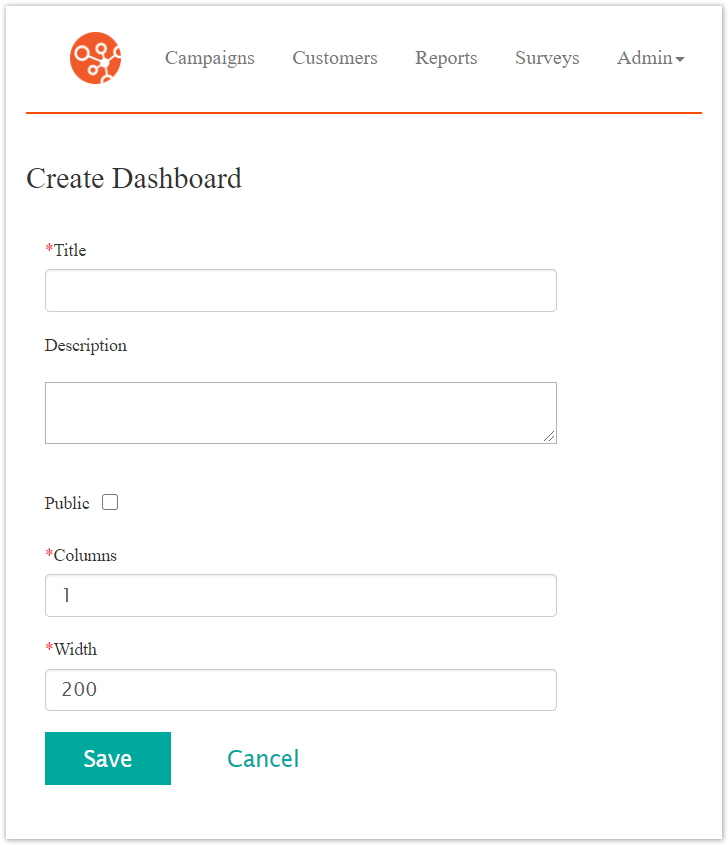
Enter the dashboard details:
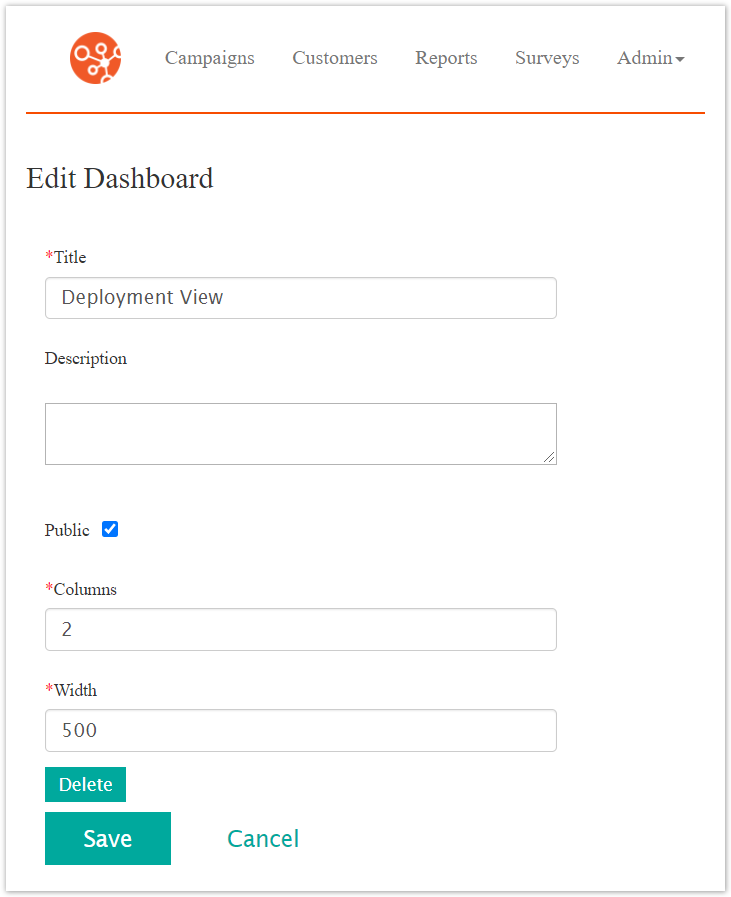
Title: The title for the dashboard
Description: A description for the dashboard
Public Flag: If checked, the dashboard is made public to other Connect users. They will be able to select the dashboard from their list of dashboards
Columns: The number of columns that will display in the dashboard. Report and statistical widgets are able to be added to the columns
Width: The width of the dashboard in pixels
Note: The width of the dashboard is a fixed value so that the columns will be uniformly displayed in the dashboard. You may wish to adjust the width to accommodate the number of columns appropriately. 200 pixels per columns is recommended. For more information on editing dashboards, please see Editing Dashboards.
To cancel without saving the new dashboard, click the Cancel Button.
The Dashboard screen displays. The dashboard is not saved.
Click the Save button.
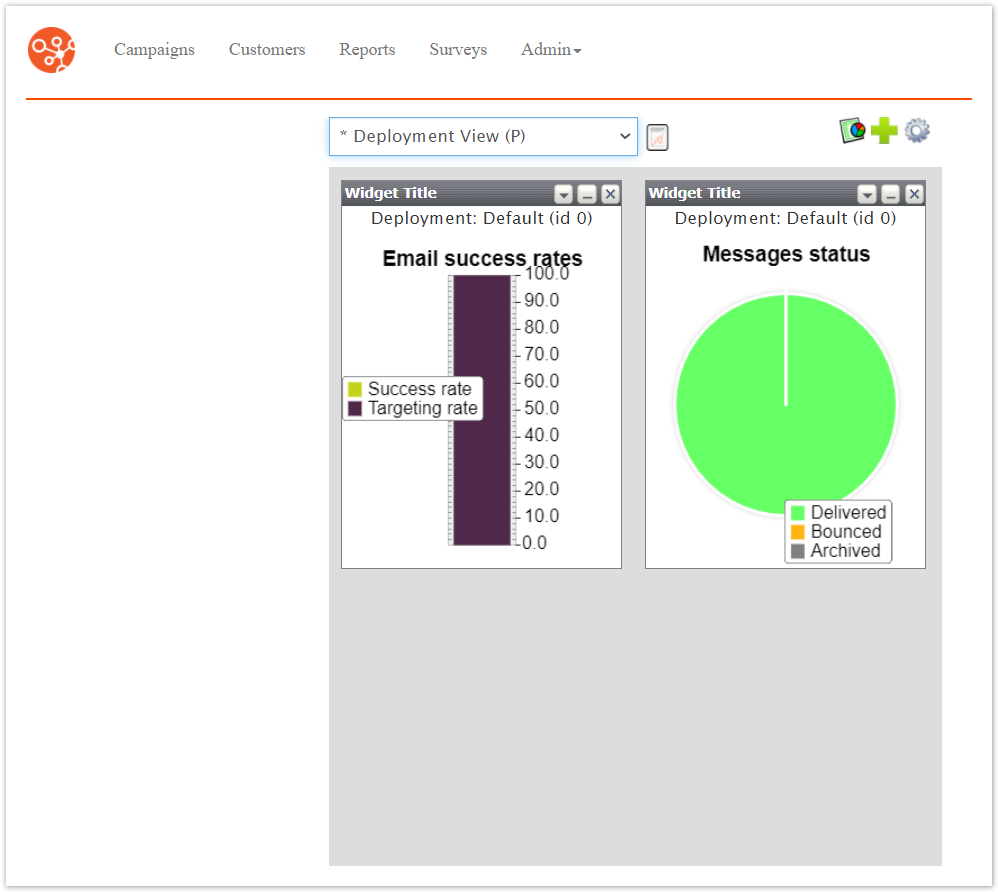
The Dashboard screen displays, displaying the newly created dashboard.
Drag and drop the '
 icon onto the dashboard into the desired column to add a reporting widget to the dashboard.
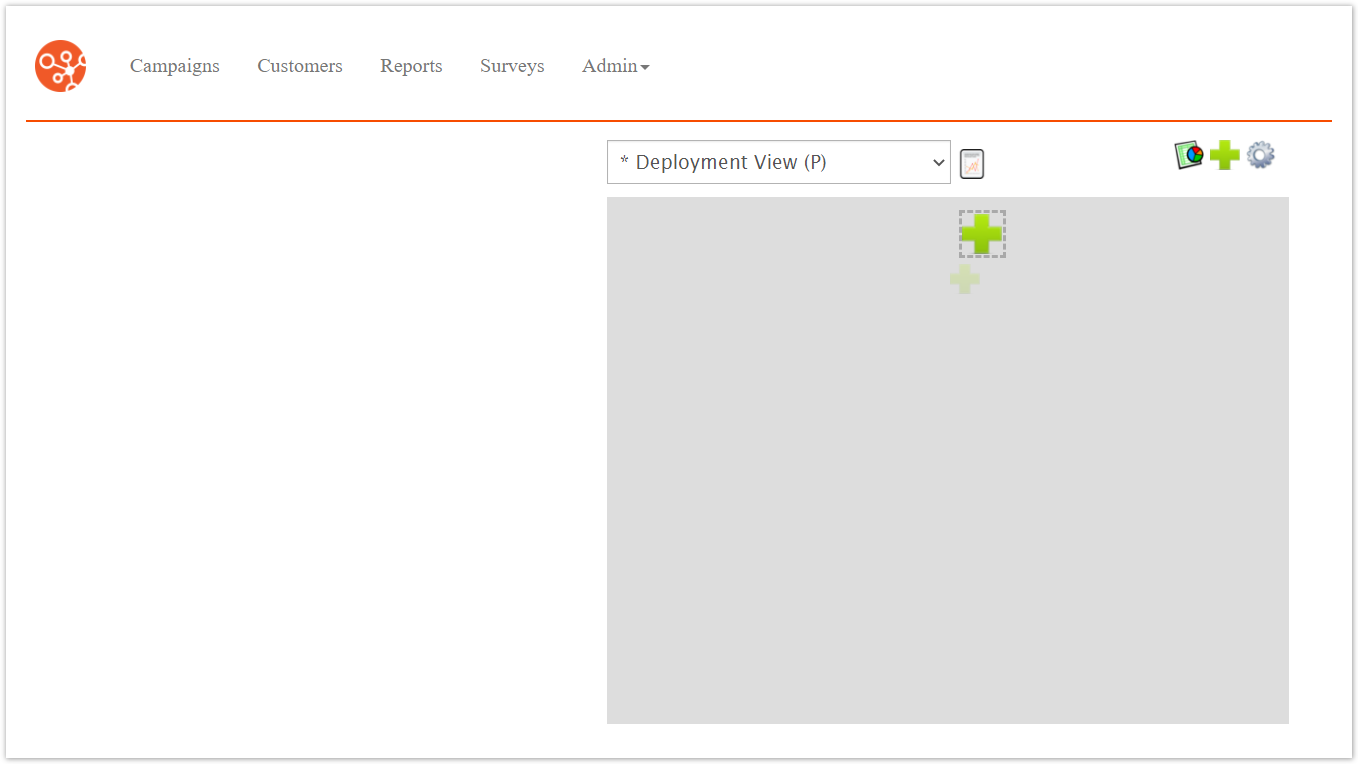
Once in position, the widget tile details displays.
Enter the details for the widget:
Title: The displayed title for the widget
Description: The description for the widget
Type: The type of widget to be displayed. Each of the different widget types will require different information for appropriate display
URL: A specific URL of a website
Height: The height of the display widget in pixels
URL: The specific URL of the website to be displayed in the widget
Chart URL: A specific URL displaying in a chart format
Height: The height of the display widget in pixels
URL: The specific URL of the website to be displayed in the widget
Report: The results of a specific custom Connect Report
Height: The height of the display widget in pixels
Report: The custom Connect report to display
Email Success Rates Chart: Chart displaying the number of successful email deliveries
Height: The height of the display widget in pixels
Refresh Interval: The time interval when the chart will be refreshed (in seconds)
Deployment: The Connect deployment that will be reported on
Components Status Chart: Displays the status of all Connect messaging components
Height: The height of the display widget in pixels
Refresh Interval: The time interval when the chart will be refreshed (in seconds)
Deployment: The Connect deployment that will be reported on
Campaigns Status Chart: Displays the status of campaigns
Height: The height of the display widget in pixels
Refresh Interval: The time interval when the chart will be refreshed (in seconds)
Deployment: The Connect deployment that will be reported on
Messages Status Chart: Displays the status of campaign messages
Height: The height of the display widget in pixels
Refresh Interval: The time interval when the chart will be refreshed (in seconds)
Deployment: The Connect deployment that will be reported on
Realtime Monitor: Monitors all of the Connect message analytics
Type: The Connect operational area to monitor (e.g. campaign activity, customer response)
Refresh Interval: The time interval when the chart will be refreshed (in seconds)
Deployment: The Connect deployment that will be reported on
Campaign Result Chart: Details the success of campaigns
Result Type: The results to be tabulated (e.g. opens, clicks)
Campaign: The campaign being reported
Height: The height of the display widget in pixels
Campaign Overview: Displays an overview of active campaigns
Days: The number of days to report on from today
Active Campaign Count: The number of active campaigns to report on
Creating Campaign Count: The number of campaigns currently being created (i.e. not active) to report on
Height: The height of the display widget in pixels
Recent Campaigns Status Chart: Displays recent activity in campaigns
Show Recent Campaign Activity for Past Minutes: The number of previous minutes to display the previous activity
Refresh Interval: The time interval when the chart will be refreshed (in seconds)
Height: The height of the display widget in pixels
Department: The department associated to the returned campaigns (leave blank for all)
To cancel without saving the widget, click the Cancel button.
The dashboard displays, the widget is not saved or displayed.
Click the Save button.
The dashboard displays with the new widget added to the dashboard.